Ulcer Index
An Alternative Approach to the Measurement of
Investment
Risk & Risk-Adjusted Performance
by Peter G. Martin
This page also available in PDF format
What
is the Ulcer Index?
Ulcer Index (UI) is a method for measuring investment risk
that addresses the real concerns of investors, unlike the widely used standard
deviation of return (SD). UI is a measure of the depth and duration of
drawdowns in prices from earlier highs.
Using UI instead of SD can lead to very different conclusions
about investment risk and risk-adjusted return, especially when evaluating
strategies that seek to avoid major declines in portfolio value (market
timing, dynamic asset allocation, hedge funds, etc.).
The Ulcer Index was originally developed by the author
of this page in 1987. Since then, it has been widely recognized and adopted by the
investment community. According to Nelson Freeburg, editor of Formula
Research, Ulcer Index is “perhaps the most fully realized statistical
portrait of risk there is.”
The Index was first described in The Investor's
Guide to Fidelity Funds: Winning Strategies for Mutual Fund Investors,
by myself and Byron McCann. Originally
published by John Wiley & Sons in 1989, this out-of-print book is available
in PDF format from http://www.tangotools.com/ui/fkbook.pdf.
Ulcer Index is also explained on Wikipedia at http://en.wikipedia.org/wiki/Ulcer_Index
Note: There have been instances of the term "Ulcer Index" being
used for risk measures that do not strictly follow the details described
here. This document explains the correct use of the concept.
What's
Wrong with Standard Deviation of Return?
Standard deviation is a statistical measure of the variability
or unpredictability of an investment's return. As a measure of risk, it suffers from a number
of serious drawbacks:
-
Both upward and downward changes in value add to the calculated
SD. Real investors associate risk only with the downside. Rising prices
create profits, not risk.
-
The calculated value of SD is not affected by the sequences
in which gains and losses occur. Thus, SD does not recognize the strings
of losses that result in significant drawdowns in value. The three hypothetical
investments in the chart below have the same annualized return (-0.52%/year) and the
same SD (4.66%/month), but no rational investor would consider them as having the same
risk.

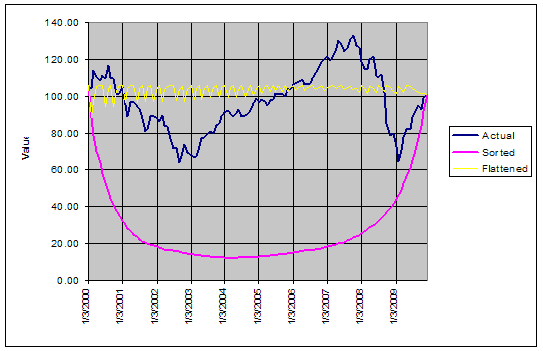
This chart shows the NAV of an S&P 500 Index
mutual fund with dividends reinvested, using monthly data over the 10 years
2000-2009. The Actual (dark blue) line is the fund's actual performance. The
Sorted (magenta) line was obtained by re-arranging the monthly percentage returns, so
that the worst months occur first and the best ones occur last. The Flattened
(yellow) line was obtained by shuffling the monthly returns in such a way as to
minimize the depth and duration of drawdowns. The set of monthly returns is the
same in each case; only their order has been changed. See http://www.tangotools.com/ui/SD.xls.
-
When SD is used to measure the risk of a market timing strategy,
it will tell you roughly how often you were out of the market, but nothing
about whether you were out at the right times. SD doesn't tell you if your
strategy reduced risk by avoiding market downturns.
Because of these weaknesses, SD does not reward an investment
strategy for avoiding market downturns. Using Ulcer Index as a risk measure
avoids all of these problems.
What
About Other Risk Measures?
Other established risk measures have weaknesses too. For
example:
-
Some are based on the single worst event over a time period,
which by definition has no statistical significance (e.g. Worst Trade and
Maximum Drawdown).
-
Some are based on absolute rather than percentage price changes,
which distorts results over longer periods with strong price trends (e.g. Average
Maximum Retracement).
-
Some tell you how often you lost money, but
not how much (e.g.
Percentage Losing Quarters).
-
Some cannot be used to compare investment alternatives.
For example, Percentage Losing Trades cannot be used to compare a market timing strategy
with a buy-and-hold approach, because the latter has no
trades.
How is Ulcer Index
Calculated?
Ulcer Index measures the depth and duration of
percentage drawdowns
in price from earlier highs. The greater a drawdown in
value, and the longer it takes to recover to earlier highs, the higher
the UI. Technically, it is the square root of the
mean of the squared percentage drawdowns in value. The squaring effect penalizes large drawdowns proportionately more
than small drawdowns (the SD calculation also uses squaring).
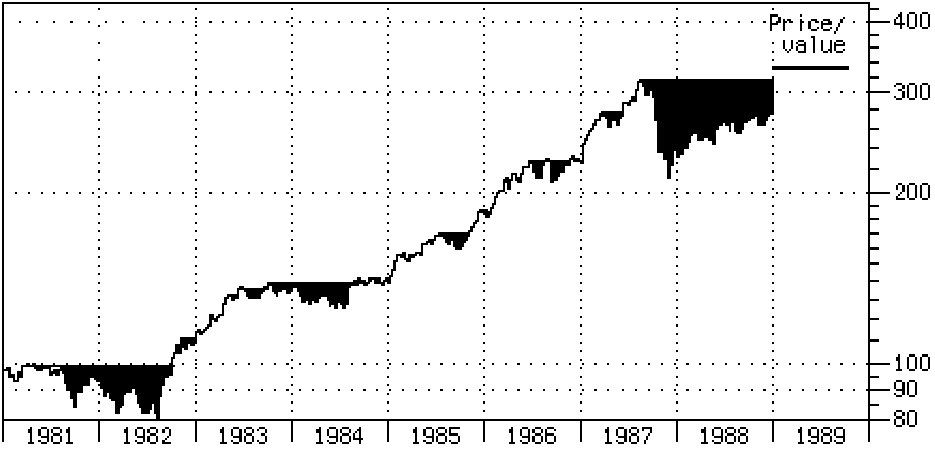
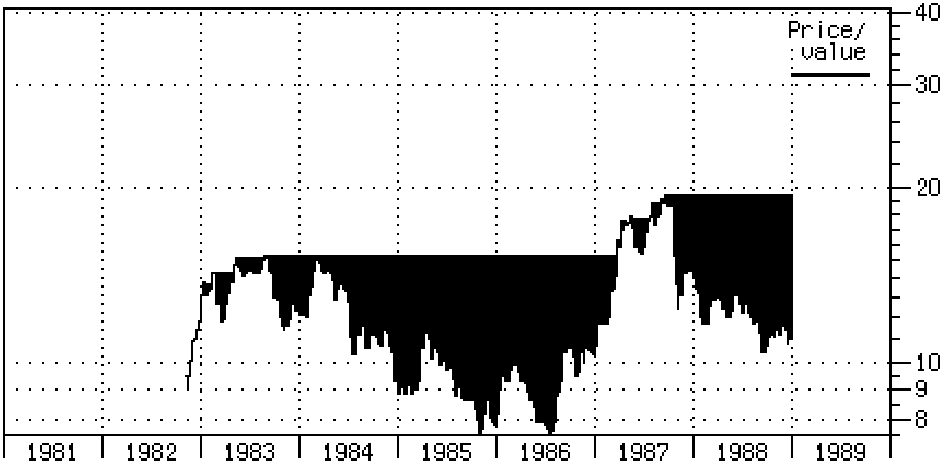
In effect, UI measures the "severity"
of drawdowns, as represented by the dark regions in the charts below:

Drawdowns in value: S&P 500 index with dividends reinvested

Drawdowns in value: Fidelity Select Precious Metals & Minerals
fund
The algorithm for computing UI is simple, and can be seen
in the pseudo-code fragment below:
SumSq = 0
MaxValue = 0
for T = 1 to NumOfPeriods do
if Value[T] > MaxValue then MaxValue
= Value[T]
else SumSq = SumSq + sqr(100 * ((Value[T]
/ MaxValue) - 1))
UI = sqrt(SumSq / NumOfPeriods)
An Excel spreadsheet showing how to calculate the
Ulcer Index is available at http://www.tangotools.com/ui/UlcerIndex.xls
UI has a further advantage over SD. Its
calculated value is essentially the
same over a wide range of time intervals between data points. Weekly price data
is a robust choice, but daily data can be used as well. As the interval
is extended beyond a week, there is an increasing danger of missing significant
intra-period drawdown-and-recovery events. The use of quarterly or longer
intervals is strongly discouraged for this reason.
Unlike UI, the calculated value of SD depends
directly on the time
period used. For example, the SD of annual return is roughly 7.2 times the SD of
weekly return (7.2 is the square root of 52 weeks per year). Since the time
period is often unstated, this creates opportunities for serious
misunderstandings about an investment's risk.
Measuring
Investment Performance
A popular method for measuring investment "performance" is
to divide the excess return of an investment by its risk. (Excess return
is total return minus the return offered by risk-free investments such as money
market funds.) This
calculation provides a single number that accounts for both return and
risk. It reports the additional return achieved per unit of risk assumed.
Traditionally the Sharpe Ratio is used, where risk is again represented
by the standard deviation of return:
Sharpe Ratio = (Total return - Risk-free
return) / SD
Just as SD is a poor risk measure, so is this formula a poor
performance measure. This problem is solved by simply replacing SD with
UI. This new performance measure is known as the "Ulcer Performance Index"
(UPI) or
"Martin Ratio".
UPI = (Total return - Risk-free
return) / UI
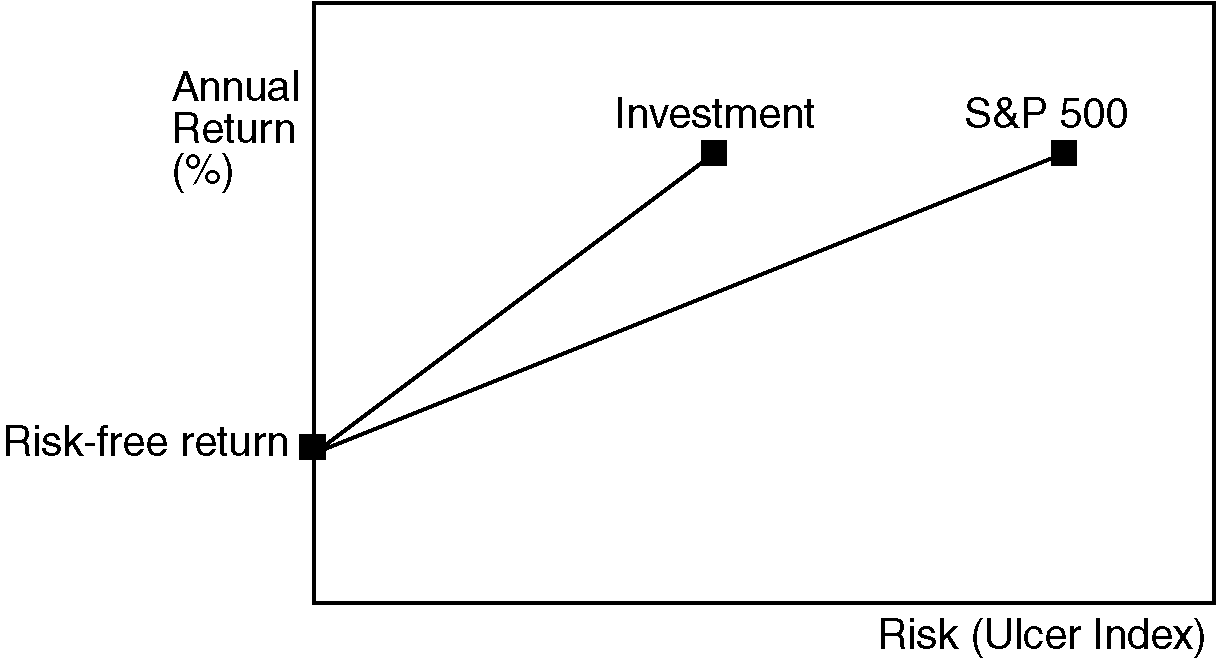
When plotting investments on a risk vs return chart, UI
can be used instead of SD for the horizontal (risk) axis.

If a line is drawn between the points representing the
risk-free return and a risky investment, the slope of the line is equal
to the Ulcer Performance Index. As with the Sharpe Ratio, if an investment lies above the line joining
the risk-free return with the S&P 500, the investment is "beating the
market" on a risk-adjusted basis.
Market
Timing Example
The table below shows the results achieved with both UI and
SD. We compared two strategies over the period 1940-1997: buy-and-hold
the S&P 500 index, and timing the index with a simple momentum indicator. Results
include reinvestment of dividends in both cases.
|
Buy-and-Hold |
Timing System |
% Change |
| Annualized Total Return (%/yr) |
12.59 |
14.79 |
17.5 |
| Ulcer Index (%) |
8.85 |
5.14 |
-41.9 |
| Ulcer Performance Index (UPI) |
0.92 |
2.01 |
118.9 |
| Standard Deviation (%/yr) |
16.10 |
13.18 |
-18.1 |
| SD Performance (Sharpe Ratio) |
0.51 |
0.78 |
52.9 |
For the timing system, annualized total return is increased
by a modest 2.2 percentage points over buy-and-hold. SD reports 18% lower risk and 53% higher performance
(Sharpe Ratio). UI reports 42% lower risk and 119% higher performance (UPI). Thus, UI places a much higher value on the market timing system than
does SD.
Other experimental work has shown that many popular market
timing systems have little value when SD is used to measure risk, but significant
value when UI is used instead. This arises because SD fails to
recognize the success of timing systems in avoiding major market downturns.
Caveat
Emptor
With any method for computing investment risk and performance, it is
important to use data covering as long a time period as possible. In particular,
the measurement period must include both bull and bear markets for the investments
of interest. Needless to say, when comparing multiple investments, the
same time period must be used in each case.
All risk and return calculations should include reinvestment of interest, dividends
and other distributions; and should be net of all recurring fees, transaction
costs and trading slippage.
Any use of Ulcer Index or UPI that falls
outside of these constraints would be inappropriate and of little value.
This page
also available in PDF format
(C) Copyright
1987-2011 by Peter G. Martin.
All rights reserved.
|


